Almost every forecast meeting at a B2B technology company has a moment like this. Someone opens the CRM on the screen, the total value of the pipeline looks promising, the team leaves the room feeling confident, and yet the month still closes below target.
This disconnect is more common than it seems. A Gartner survey of sales leaders showed that only 45% of leaders and salespeople truly trust the accuracy of their company’s forecast. In other words, more than half of all operations make hiring decisions, media investment decisions, and set goals based on a number they don’t believe in.
Most of the time, the problem isn’t with the product or the team’s talent. It’s in how the B2B sales pipeline is built, nurtured, and reviewed. In this guide, you’ll learn what sets a real pipeline apart from a list of contacts, which stages and criteria move an opportunity forward, which metrics indicate the health of the operation, and which routines keep it all running week after week.
What is a B2B sales pipeline, and why does it determine revenue predictability?
Practical definition: a visual map of the business process
A sales pipeline is a structured representation of all of a company’s active opportunities, organized by the stages of the sales process. In practice, it’s that columnar table in the CRM where each card represents an ongoing deal, with an estimated value, assigned person, current stage, and agreed-upon next step.
One detail is very important here: a pipeline is made up of opportunities, not leads. A lead is someone who has shown some interest, such as downloading a document or filling out a form. An opportunity is an actual deal, with an identified pain point and an ongoing sales conversation. Mixing the two is the first step toward a pipeline that looks big but delivers little.
But this forecast only works when each step means the same thing to everyone on the team.
Pipeline vs. Sales Funnel: Understanding the Key Differences
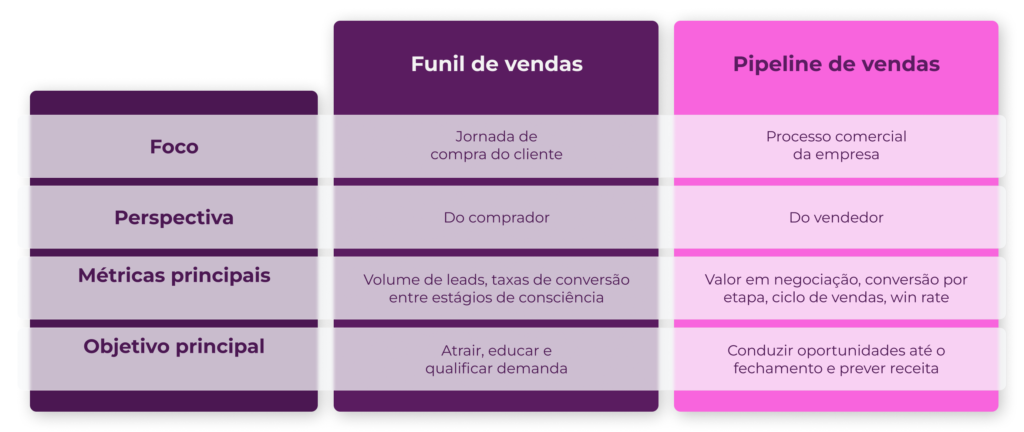
The two terms are often used interchangeably, but they describe different perspectives on the same process.
The sales funnel tracks the buyer’s journey—that is, the path a customer takes from realizing they have a problem to deciding on a solution. It represents the buyer’s perspective, organized by levels of awareness (top, middle, and bottom of the funnel).
The sales pipeline tracks sales activities: which stages the team goes through, what activities take place at each stage, and what criteria move a deal forward. It’s the salesperson’s perspective.
Understanding this difference has become even more important in B2B. According to Gartner, B2B buyers spend only about 17% of their buying journey talking to suppliers, and that time is further divided among all the competitors being evaluated. The rest takes place away from the salesperson: independent research, internal discussions within the purchasing committee, and, increasingly, consultations with AI tools such as ChatGPT. In other words, a large part of the funnel unfolds before the opportunity even appears in the pipeline, which is why marketing and sales need to look at both sides at the same time.
If you'd like to learn more about this topic, we recommend reading our content on personalization in the B2B buying journey.
The Illusion of the Inflated Pipeline: Why Volume Doesn't Equal Revenue
A full pipeline conveys a sense of security. The problem is that accumulated value is not the same as actual value. Deals that have been stalled for months, closing dates pushed back quarter after quarter, and opportunities with no next steps scheduled continue to add to the total and distort the forecast (the revenue projection for the period).
Sandler, one of the most established sales training firms in the market, shares the story of a salesperson who seemed to have the best pipeline on the team: even though he closed deals at the same pace as his colleagues, it took him more than twice as long to walk away from deals that weren’t going to happen. In practice, the pipeline was full, but it contained many accounts that weren’t going to close —accounts that could have freed up more time for the salesperson to focus on other activities.
The same logic applies to the marketing side. When demand generation is measured solely by lead volume, the top of the funnel grows, but the number of closed deals doesn’t keep pace. We discuss this in detail in the article “MQL Is Not Pipeline.”
The 3 Questions That Distinguish a Real Pipeline from a Contact List
A functional pipeline must provide answers based on data, not intuition:
- How much can the company earn during this period?
- When are these closures scheduled to take place?
- With what level of confidence can we say that?
If any of these answers depend on the “gut feeling” of the person leading the meeting, the pipeline is not yet fulfilling its role.
The 7 Essential Steps of a High-Performance B2B Pipeline
There is no universal number of stages. For B2B consultative sales, a framework with five to seven stages usually works well: few enough that the team doesn’t get lost, and detailed enough to show where negotiations stall.
More important than the number of columns is what defines the transition from one to the next. Each stage requires transition triggers: objective criteria that prove the negotiation has actually progressed, and not just in the salesperson’s mind. According to RD Station’s 2026 Marketing and Sales Outlook, only 33% of Brazilian companies have structured sales processes, and those that do perform better in meeting their goals.
Below is a seven-step model that you can adapt to your operation.
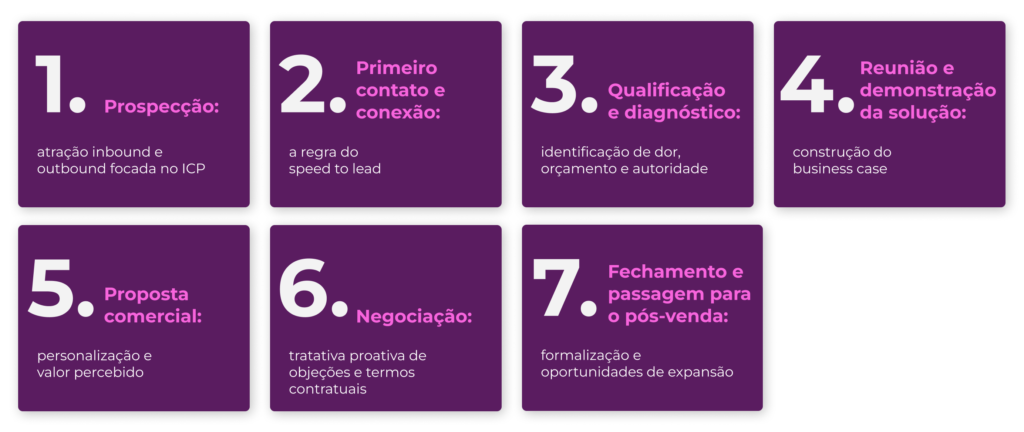
1. Lead Generation: Inbound and Outbound Lead Generation Focused on the ICP
It all starts with defining the ICP: a description of the company that stands to benefit the most from your solution and is most likely to make a purchase, taking into account industry, size, maturity, and the type of problem.
Based on the ICP, lead generation follows two complementary paths. In inbound marketing, the company attracts potential customers through content, SEO, and paid media, and they come to you. In outbound marketing, the sales team actively pursues accounts that match the profile.
The most common mistake here is to optimize lead generation by volume rather than by alignment with the ICP. A good paid media plan, for example, measures success by the number of leads generated, not just by clicks. When this doesn’t happen, the result is that familiar scenario of campaigns that generate clicks but not customers.
2. First Contact and Connection: The “Speed to Lead” Rule
Speed to lead is the time between when a potential customer shows interest and the sales team’s first contact. And few variables have such a significant—and yet so underestimated—impact.
A study published in the Harvard Business Review, which analyzed more than one million leads from B2B and B2C companies in the United States, showed that companies that reached out within an hour were nearly seven times more likely to qualify the lead than those that waited a little longer, and more than 60 times more likely than those that took 24 hours or more. An earlier study conducted by James Oldroyd, a co-author of that article, was even more specific: contacting a lead within 5 minutes, rather than 30, increased the chances of qualification by a factor of about 21.
In practice, reducing the speed to lead depends less on individual effort and more on process: automatic lead distribution in the CRM, real-time alerts for the assigned sales representative, and clear rules about who handles the lead when the assigned representative is unavailable.
3. Assessment and Diagnosis: Identification of Pain, Budget, and Authority
This is where the company decides whether that conversation warrants turning into an opportunity. The assessment examines, at a minimum, four points: whether the pain point is real and relevant, whether there is a budget (or a path to one), who makes the decision, and by when the decision needs to be made. This combination forms the basis of BANT, one of the best-known qualification frameworks (an acronym for budget, authority, need, and time). More complex operations typically use more detailed models, such as SPICED or MEDDIC.
The key consideration in B2B is authority. Rarely does a single person make a decision on their own. The 2025 GTM Benchmarks report, published by Ebsta in partnership with Pavilion, shows that negotiations with new clients involve an average of eight people, and that involving decision-makers early on increases the close rate by 55%.
Effective qualification also safeguards the subsequent stages. By restructuring its lead generation efforts around the profile of the actual buyers, TWM—a Montre client— increased its qualified leads from 31% to 94%, while maintaining the same volume of incoming leads.
You can find this and other results on our case studies page.
4. Meeting and solution demonstration: developing the business case
A good demo isn't a walkthrough of all the product's features. It's the connection between what the customer shared during the needs assessment and what the solution addresses, using the customer's own terms and numbers.
The goal of this stage is to work with the client to build the business case: the business rationale that your contact will use to advocate for the purchase internally—to the finance department, the executive board, and other committee members. If the salesperson leaves the meeting without knowing how the client will sell the idea internally, the opportunity isn’t ready to move forward yet.
5. Business Proposal: Customization and Perceived Value
The proposal should be a natural progression from the previous steps, not an attempt to persuade. Generic proposals that focus on price and a list of features steer the conversation toward a direct comparison with competitors.
A strong proposal addresses the identified problem, highlights the financial impact of resolving it, and clearly outlines the scope, implementation timeline, and next steps. And one simple precaution can prevent a lot of frustration: only submit the proposal once the client’s decision-making process has been mapped out—including who approves it, in what order, and by when.
6. Negotiation: Proactive handling of objections and contractual terms
Objections aren't the end of the conversation; they're information. The most common objections in B2B typically revolve around price, implementation timeline, the risk of switching suppliers, and information security.
Mature sales teams identify these objections in advance and address each one before it becomes a roadblock. Another point to watch out for is the discount: if offered too early, it reduces the perceived value of the solution and tends to prolong the negotiation rather than speed it up.
7. Closing the deal and transitioning to after-sales service: formalization and opportunities for expansion
The closing formalizes the agreement—which today almost always involves a digital signature—and shortens the time between the verbal “yes” and the signed contract. But the pipeline doesn’t end here.
A smooth handoff to the after-sales or customer success team (the department responsible for customer success) is what ensures retention and opens the door to upselling (selling a higher-tier plan or larger volume) and cross-selling (selling complementary products).
The numbers illustrate the scale of this opportunity: according to the same report by Ebsta and Pavilion, 52% of the new revenue generated by the companies analyzed came from existing customers, and the closing rate for upselling was 45%, well above the 19% recorded for acquiring new customers.
Progress indicators: what confirms that an opportunity has moved forward
| Stage | The deal only moves forward when… |
| Lead Generation → Initial Contact | The account meets the ICP criteria, and a contact has been identified |
| Initial Contact → Qualification | A real conversation took place, and a diagnostic meeting was scheduled |
| Qualification → Demonstration | The scope, budget, decision-maker, and deadline were confirmed by the client |
| Demo → Proposal | The client has approved the business case, and the decision-making process has been mapped out |
| Proposal → Negotiation | The proposal was presented (not just sent), and the client provided feedback |
| Negotiation → Closing | Objections addressed and terms agreed upon with the undersigned |
| Closing → After-Sales | Contract signed and handover meeting held for the client's successful team |
Golden rule: If a criterion depends on the seller's opinion, it is not yet a criterion.
Metrics and KPIs for Assessing the Health and Velocity of the Pipeline
A pipeline only provides predictability when it is measured. These are the metrics that matter most.
Conversion Rate by Stage and Close Ratio: Identifying Operational Bottlenecks
The conversion rate by stage shows how many opportunities move from one stage to the next. It reveals where the process stalls. A sharp drop between qualification and demo, for example, usually indicates leads that are outside the ICP. A drop between proposal and close, on the other hand, tends to point to price objections or a poorly mapped decision-making process.
The close ratio, also known as the win rate, is the overall closing rate: the number of opportunities won out of the total number of opportunities closed during the period.
Average sales cycle and deal velocity: the speed of money in the sales funnel
The average sales cycle is the time between the creation of a sales opportunity and the signing of the contract. It varies significantly depending on the deal size: the higher the contract value, the longer and more involved the process tends to be.
Deal velocity (or sales velocity) combines four variables into a single number that shows how much revenue the pipeline generates per day:
Pipeline velocity = (number of opportunities × average ticket size × win rate) ÷ average cycle in days
Here’s an example: 40 open opportunities, with an average deal size of R$30,000, a 20% win rate, and a 90-day cycle, generate about R$2,700 per day, or approximately R$80,000 per month. The purpose of this calculation is to show which lever to pull: more opportunities, larger contracts, a better closing rate, or a shorter cycle.
Average Ticket Price and Opportunity Value: Maximizing Financial Return
The average deal size is the average value of closed deals. Tracking it helps you prioritize strategic accounts and determine, for example, whether the team is closing too many small deals while larger opportunities remain on hold.
It’s also worth looking at the weighted pipeline: instead of adding up the gross value of all opportunities, each one is multiplied by the historical probability of closing at the stage it’s in. A R$100,000 deal in the qualification stage isn’t worth the same as a R$100,000 deal in the negotiation stage, and the forecast needs to reflect that.
Pipeline coverage ratio: the 3x to 4x target rule (and when it isn't enough)
Pipeline coverage compares the value of open opportunities to the period's target:
Pipeline coverage = total value of the qualified pipeline ÷ revenue target for the period
The most commonly cited guideline in the market is to maintain 3 to 4 times the target value in active opportunities. But this rule overlooks an important factor: it only works for trades with a close rate between 25% and 33%. The most accurate way to calculate the necessary coverage is to divide 1 by your historical win rate.
| Historical Win Rate | Required coverage |
| 33% | 3x |
| 25% | 4x |
| 20% | 5x |
| 15% | about 6.7x |
In practice: if the quarterly goal is R$ 300,000 and the team closes 25% of its opportunities, the pipeline needs to total R$ 1.2 million.
B2B Pipeline KPIs
| KPI | How to calculate | What it reveals | Reference |
| Step-by-Step Conversion | Opportunities that have advanced ÷ opportunities that have entered this stage | Where the process hangs | Compare it to your past performance; look into the biggest drops |
| Win rate (close ratio) | Opportunities won ÷ opportunities closed | Overall closing efficiency | 19% of new customers (Ebsta & Pavilion, 2025) |
| Average sales cycle | Average number of days between the creation of the opportunity and its closure | Pace of the business process | It varies depending on the ticket; track the trend month by month |
| Deal velocity | (Opportunities × ticket × win rate) ÷ cycle | Daily revenue | It is expected to grow or remain stable |
| Average ticket price | Total revenue ÷ number of contracts | Average transaction value | Compare by segment and by source channel |
| Pipeline coverage | Qualified pipeline ÷ target | If there is enough volume to reach the target | 1 ÷ win rate (3x to 4x only with a win rate of 25% to 33%) |
Management rituals and best practices for avoiding bottlenecks in the pipeline
Structure and metrics cannot stand on their own. What keeps the pipeline reliable is the review process.
Weekly Pipeline Review: Focus on Actions, Risks, and Next Steps
The pipeline review is a short meeting—30 to 45 minutes—between a manager and salespeople. The most common mistake is turning it into a report on what happened last week. The focus should be on what needs to happen next week.
A script that usually works well:
- At-risk deals: opportunities that have stalled, have a past-due closing date, or have had no recent contact with the decision-maker.
- The next step for every relevant business: what was agreed upon with the customer, including a specific date—not just what the salesperson intends to do.
- Coverage and forecast: whether the qualified pipeline supports the period’s target, and what to do if it does not.
In addition to the weekly meeting, each salesperson should review their own pipeline every day, prioritizing the deals closest to closing without neglecting those that are still in the early stages and will ensure results in the coming months.
Periodic cleaning and sanitizing: removing dead deals without hesitation
Cleaning up the pipeline means removing opportunities that aren’t going to close. A rule of thumb used by many teams is to review any opportunity that has been stagnant for more than 1.5 times the average cycle time. If there isn’t a next step scheduled with the client, it should be marked as lost, with the reason for the loss recorded.
This record is what turns the cleanup process into a learning experience: over time, the reasons for lost opportunities reveal patterns (price, competition, lack of priority, wrong profile) that help marketing and sales teams refine the process. And it’s worth emphasizing: closing out an opportunity is not a failure. Failure is letting it inflate the forecast for months on end.
Aligning SLAs Between Marketing and Sales (MQLs and SQLs)
An SLA (Service Level Agreement) is an internal agreement that defines what Marketing delivers to Sales and what Sales does with what it receives. It depends on two clear definitions:
- MQL (Marketing Qualified Lead): a lead that the marketing team considers ready for a sales approach, based on profile and behavior criteria.
- SQL (Sales Qualified Lead): a lead that the sales team has validated as a real business opportunity.
A good SLA documents the criteria for each stage, the timeframe for the first sales follow-up after receiving a lead (referring back to “speed to lead”), and the requirement to record the reason for each rejection. Without this feedback, marketing continues to invest in the same campaigns without knowing which ones resulted in a deal. That is precisely why MQL alone is not a good metric for success.
Smart Use of CRM and Sales Automation
CRM is where the pipeline actually exists. It centralizes each account’s history, logs interactions, and relieves the salesperson of repetitive work. Some automation features make a big difference in day-to-day operations: automatic lead distribution, creation of follow-up tasks (to follow up after each contact), alerts for inactive opportunities, and required fields for advancing to the next stage, which ensure that stage transition triggers are followed.
Artificial intelligence features are also already part of the major platforms, including automatic lead scoring, next-step suggestions, and risk alerts. But no AI can fix a poorly designed process—it merely speeds up what already exists. That’s why CRM management and automation workflows must come after the steps and criteria have been defined, not before.
The 4 Mistakes That Destroy the Pipeline
- Unfounded optimism: Opportunities move forward because the salesperson “felt” that the conversation went well, not because an objective trigger was met.
- Forecast based on gut feeling: the revenue forecast depends on the opinion of the person in charge, rather than on the conversion history for each stage.
- No agreed-upon next step: the deal does not have a date set with the client; there is only the seller’s intention to “follow up.”
- Status meeting without follow-up: the pipeline review becomes a report on what has happened, without any decisions on what to do about at-risk deals.
Conclusion and Quick Implementation Checklist
Turning Business Processes into a Competitive Advantage
Revenue predictability doesn’t come from a team of exceptional salespeople, nor from a massive pipeline. It comes from a method. An average team with clear steps, objective criteria, and a review routine tends to deliver more predictable results than talented salespeople each working in their own way.
In summary, a healthy B2B sales pipeline has stages that reflect the actual process, progression triggers that aren’t based on opinion, metrics tracked weekly, a clean database, and marketing and sales teams operating based on the same definitions.
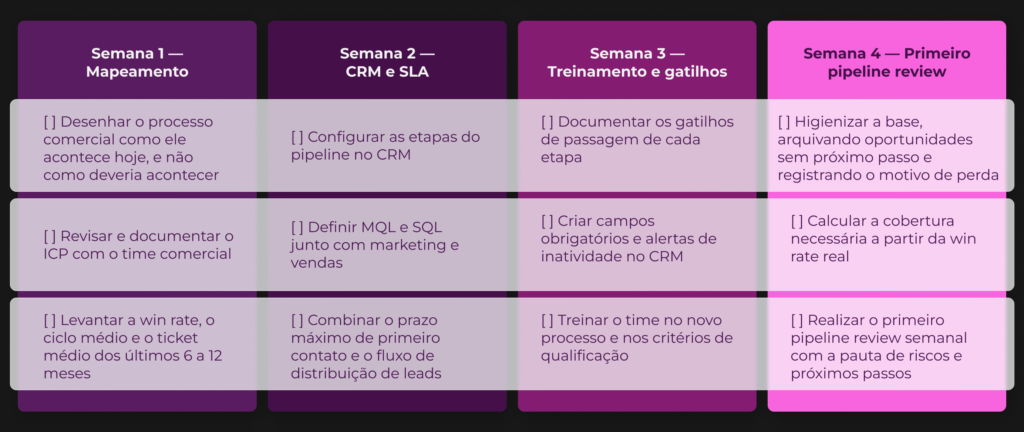
30-Day Checklist for Structuring Your Pipeline
If you want to find out where your pipeline is stalling—from the top to the close—Montre will conduct a diagnostic assessment of your marketing and sales operations. Schedule your diagnostic assessment here and see how other B2B tech companies have improved their results with us.
Frequently Asked Questions
The pipeline is the set of open opportunities, organized by stage. The forecast is an estimate of how much of that pipeline will turn into revenue over a given period. A reliable forecast depends on a clean pipeline and historical conversion rates by stage.
There is no set number, but between five and seven stages usually work well for consultative sales. What matters is that each stage has objective entry and exit criteria and reflects the company’s actual process.
No. It assumes a close rate of about 33%. The most accurate calculation is to divide 1 by your historical win rate: if you close 20% of your opportunities, you need about 5 times that amount in your pipeline.
The review of dormant opportunities should be part of the weekly pipeline review. In addition, it’s a good idea to conduct a more thorough cleanup each month or quarter, reclassifying all open opportunities.
A spreadsheet might work at first, when there are only a few deals and one salesperson. As the volume and the team grow, a CRM becomes necessary to maintain a history, automate tasks, and generate metrics without manual effort.